Decision Support Software
 The development of these decision support software tools was mainly funded by the
University of Arkansas System Division of Agriculture. Researchers within the Arkansas
Agricultural Experiment Station, experts around the nation, and USDA ARS carried out
field trials, livestock research, and equipment performance trials thereby contributing
their expertise to the creation of each tool. For more information about the Arkansas
Agricultural Experiment Station, please visit https://aaes.uark.edu/.
Click on the appropriate logo below for more information and to download the decision support software.
FORCAP version 3 is expected in the near future
![]() Forage & Cattle Planner User Manual v.2 2014
Forage & Cattle Planner User Manual v.2 2014
![]() Forage & Cattle Planner Reference Manual
Forage & Cattle Planner Reference Manual
![]() FORCAP v.2 2014 - Click to download spreadsheet. Follow installation instructions in the user manual.
FORCAP v.2 2014 - Click to download spreadsheet. Follow installation instructions in the user manual.
Please email Michael Popp to let him know if you wish to use the spreadsheet for research purposes. The program is available at no charge but a number of parameters are specific to Arkansas and are not easily modified to other situations without access to program code.
![]() FORCAP by Michael Popp, Aaron Smith, Daniel Keeton and William Maples is licensed under a Creative Commons Attribution-NonCommercial-NoDerivs 3.0 Unported License.
FORCAP by Michael Popp, Aaron Smith, Daniel Keeton and William Maples is licensed under a Creative Commons Attribution-NonCommercial-NoDerivs 3.0 Unported License.
![]() Energy Crop Analysis & Planning User Manual
Energy Crop Analysis & Planning User Manual
![]() ENCAP - Click to download spreadsheet. Follow installation instructions in the user manual.
ENCAP - Click to download spreadsheet. Follow installation instructions in the user manual.
Please email Michael Popp to let him know if you wish to use the spreadsheet for research purposes. The program is available at no charge but a number of parameters are specific to Arkansas and are not easily modified to other situations without access to program code.
![]() ENCAP by Michael Popp, Karen Lindsay and Nathanial Cahill is licensed under a Creative Commons Attribution-NonCommercial-NoDerivs 3.0 Unported License.
ENCAP by Michael Popp, Karen Lindsay and Nathanial Cahill is licensed under a Creative Commons Attribution-NonCommercial-NoDerivs 3.0 Unported License.
 SOYMAP is a software tool to assist producers with choosing a soybean maturity group
and planting date. The tool uses simulation data that is based on multi-year soybean
research trials conducted across 10 states to analyze MG and planting date effects.
The software allows comparison of two MG selections for an array of planting date,
location, and soil texture options. Results show agronomic performance information
such as time window for different growth stages, expected yield, and irrigation needs.
Using historical 30-year weather data, simulations allow determining a range of outcomes
for these performance measures and attendant economic return estimates. Economic assessments
include seasonal sale price, user-specified irrigation cost, and risk implications
as well as sensitivity and breakeven analyses.
![]() Soybean Maturity Analysis & Planning User Manual-v.5
Soybean Maturity Analysis & Planning User Manual-v.5
IMPORTANT: Note that in early 2019 the R5 dates were updated to be consistent with Fehr and Caviness' (1977) definition. The previous version of SOYMAP-v.4 or earlier gave dates for the first R5 on the plant, regardless of the position of the pod. This update added 7 days to the R5 date regardless of MG and planting date based upon results from (Salmeron and Purcell, 2016).
To receive software updates for SOYMAP, enter your email address below and click the submit button.
![]() SOYMAP-v.5 - Please pay close attention to the top paragraph on p. 2 of the user manual before
using the software. Should you be experiencing difficulties with Excel on your machine
at this time, please send an e-mail to Michael Popp (mpopp@uark.edu). Thank you.
SOYMAP-v.5 - Please pay close attention to the top paragraph on p. 2 of the user manual before
using the software. Should you be experiencing difficulties with Excel on your machine
at this time, please send an e-mail to Michael Popp (mpopp@uark.edu). Thank you.
Please "Save As" to a directory on your computer. Before opening please close any other excel files that you may have open.
Please email Michael Popp to let him know if you wish to use the spreadsheet for research purposes. The program is available at no charge but a number of parameters are project-specific and are not easily modified to other situations without access to program code.
![]() SOYMAP by Montserrat Salmeron, Michael Popp and Larry Purcell is licensed under a Creative Commons Attribution-NonCommercial-NoDerivs 3.0 Unported License.
SOYMAP by Montserrat Salmeron, Michael Popp and Larry Purcell is licensed under a Creative Commons Attribution-NonCommercial-NoDerivs 3.0 Unported License.
 SOYRISK is a software tool that builds on SOYMAP in the sense that a producer often
chooses seed from different maturity groups and planting occurs over a range of dates.
The tool optimizes the mix of MG and planting dates that either: i) maximizes profitability
subject to a given level of risk; ii) minimizes risk subject to a given level of return;
or iii) meets an irrigation limit set by the user. The analysis can also be restricted
to different planting windows, soil textures and locations. Results compare current
producer plans to optimized outcomes.
To receive software updates for SOYRISK, enter your email address below and click the submit button.
![]() SOYRISK - Please "Save As" to a directory on your computer. Before opening please close any
other excel files that you may have open.
SOYRISK - Please "Save As" to a directory on your computer. Before opening please close any
other excel files that you may have open.
Please email Michael Popp to let him know if you wish to use the spreadsheet for research purposes. The program is available at no charge but a number of parameters are project-specific and are not easily modified to other situations without access to program code.
![]() SOYRISK by Michael Popp, Larry Purcell, Montserrat Salmeron Cortasa, and Weston Weeks is licensed under a Creative Commons Attribution-NonCommercial-NoDerivs 3.0 Unported License.
SOYRISK by Michael Popp, Larry Purcell, Montserrat Salmeron Cortasa, and Weston Weeks is licensed under a Creative Commons Attribution-NonCommercial-NoDerivs 3.0 Unported License.
 PAM is a planning tool that evaluates the effectiveness of various Palmer amaranth
management options (row spacing, seedbed preparation, crop and crop trait choice over
a ten year period, herbicide selection, post-harvest cover crops, burning of residue,
or plowing) on long-term Palmer amaranth seedbank dynamics and economic returns in
corn, soybean, and cotton. PAM integrates agronomic, biological, and economic information
to help users understand the long-term implications of a given management strategy,
or a lack thereof, and thereby make informed management decisions. The model is intended
to serve educational needs about integrated weed management. PAM is not an herbicide resistance simulation model; however, it adequately accounts for any
pre-existing resistance and the likelihood for developing resistance under any chosen
strategy.
The PAM tool has undergone some revisions to address user comments. We have added extra links for herbicide compliance issues, updated herbicide and seed cost prices and made some other minor changes to make the tool more user friendly (like picking a printer and disabling the copy and paste function). Also, please pay close attention to pages 9-11 of the user manual before using the software. Should you experience difficulties with Excel on your machine, please send an e-mail to Michael Popp (mpopp@uark.edu). Thank you.
![]() Palmer Amaranth Management User Manual-v3.0
Palmer Amaranth Management User Manual-v3.0
To receive software updates for PAM, enter your email address below and click the submit button.
![]() PAM-v3.0 - Please "Save As" to a directory on your computer. Before opening please close any
other excel files that you may have open.
PAM-v3.0 - Please "Save As" to a directory on your computer. Before opening please close any
other excel files that you may have open.
Please email Michael Popp to let him know if you wish to use the spreadsheet for research purposes. The program is available at no charge but a number of parameters are project-specific and are not easily modified to other situations without access to program code.
![]() PAM by Muthukumar Bagavathiannan, Karen Lindsay, Jason Norsworthy, and Michael Popp is licensed under a Creative Commons Attribution-NonCommercial-NoDerivs 3.0 Unported License.
PAM by Muthukumar Bagavathiannan, Karen Lindsay, Jason Norsworthy, and Michael Popp is licensed under a Creative Commons Attribution-NonCommercial-NoDerivs 3.0 Unported License.

The TGA tool is software that allows analysis of auto-steer or GPS guidance technology for ‘hands-free’ steering on tractors. The user can modify equipment choice, crop enterprises and a number of other default parameters to get estimates of how much input use and cost savings can occur when using this technology on their farm. The tool also calculates: i) the minimum acreage; ii) the breakeven yield improvement; iii) the minimum input use savings; and iv) the equipment efficiency improvements needed for this technology to pay for itself. Finally, the tool provides estimates of greenhouse gas emission changes on the farm with and without auto-steer. Please pay close attention to pages 2-6 of the user manual before using the software. Should you experience difficulties with Excel on your machine, please send an e-mail to Michael Popp (mpopp@uark.edu). Thank you.
![]() Tractor Guidance Analysis User Manual-v2.0
Tractor Guidance Analysis User Manual-v2.0
To receive software updates for TGA, enter your email address below and click the submit button.
![]() TGA-v1.3 - Please "Save As" to a directory on your computer. Before opening please close any other excel files that you may have open.
TGA-v1.3 - Please "Save As" to a directory on your computer. Before opening please close any other excel files that you may have open.
| Complete Overview of TGA | How to Download | Setting Up Excel |
p
Please email Michael Popp to let him know if you wish to use the spreadsheet for research purposes. The program is available at no charge but a number of parameters are project-specific and are not easily modified to other situations without access to program code.
![]() TGA by Karen Lindsay, Michael Popp, Phillip Owens, and Amanda Ashworth is licensed
under a Creative Commons Attribution-NonCommercial-NoDerivs 3.0 Unported License
TGA by Karen Lindsay, Michael Popp, Phillip Owens, and Amanda Ashworth is licensed
under a Creative Commons Attribution-NonCommercial-NoDerivs 3.0 Unported License
 The Potash Rate Calculators (PRC) is an Excel® spreadsheet tool that builds on potassium
(K) yield response trials on rice and soybean conducted over the past two decades
at experiment stations and producer fields across Arkansas. The tool, in separate
tabs for soybean and rice, respectively, provides K application rate recommendations
that are based on yield potential of a field, the field’s soil test K (STK), the crop’s
price and the cost of fertilizer. The last two factors often lead to rate recommendations
that are lower than the current recommendations targeted at: i) reaching 95-100% of
yield potential; and, ii) building and maintaining the soil (STK). Using a sufficiency
philosophy to managing STK and employing profit-maximizing K rates is expected to
lessen nutrient runoff with lesser application rates at minimal yield penalty leading
to greater producer profit. A video tutorial on how to use the software on computers
with a Microsoft based operating system is also provided.
| PRC Tutorial |
![]() PRC-v1.2 -is a newer version and includes analysis capabilities for corn and cotton. Please
"Save As" to a directory on your computer. Before opening please close any other excel files that you may have open.
PRC-v1.2 -is a newer version and includes analysis capabilities for corn and cotton. Please
"Save As" to a directory on your computer. Before opening please close any other excel files that you may have open.
![]() PRC-v1.3 -includes important updates to cotton rate recommendations along with minor changes
to soybean, corn, and rice. Please "Save As" to a directory on your computer. Before opening please close any other excel files that you may have open. If you have
used PRC-v1.2 for cotton rate recommendations please review using PRC-v1.3.
PRC-v1.3 -includes important updates to cotton rate recommendations along with minor changes
to soybean, corn, and rice. Please "Save As" to a directory on your computer. Before opening please close any other excel files that you may have open. If you have
used PRC-v1.2 for cotton rate recommendations please review using PRC-v1.3.
![]() PRC-v1.4 -includes important updates to corn rate reccomendations. Please "Save As" to a directory
on your computer. Before opening please close any other excel files that you may have open. If you have
used PRC-v1.3 or older for corn rate recommendations, please review using PRC-v1.4.
PRC-v1.4 -includes important updates to corn rate reccomendations. Please "Save As" to a directory
on your computer. Before opening please close any other excel files that you may have open. If you have
used PRC-v1.3 or older for corn rate recommendations, please review using PRC-v1.4.
Related (open access) publications are:
To receive software updates for PRC, enter your email address below and click the submit button.
Please email Michael Popp to let him know if you wish to use the spreadsheet for research purposes. The program is available at no charge but a number of parameters are project-specific and are not easily modified to other situations without access to program code.
![]() PRC by Michael Popp, Nathan Slaton, Trenton Roberts, Jacob Norsworthy, Kimberly
Oliver, and Bruce Dixon is licensed under a Creative Commons Attribution-NonCommercial-NoDerivs 3.0 Unported License
PRC by Michael Popp, Nathan Slaton, Trenton Roberts, Jacob Norsworthy, Kimberly
Oliver, and Bruce Dixon is licensed under a Creative Commons Attribution-NonCommercial-NoDerivs 3.0 Unported License
![]()
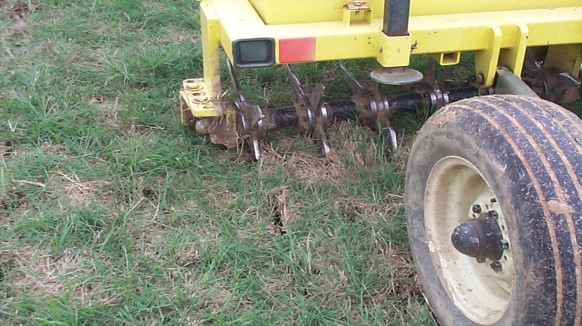
PAF is a software tool than analyzes pasture aeration which involves an implement that cuts 2-6 inch slots in the soil to a depth up to 6 inches using metal spikes. Pasture aeration is considered a valuable pasture management strategy as nutrient runoff and greater water penetration can lead to yield improvement and greater utilization of fertilizer and broadcasted litter. Application of gypsum to bind phosphorus can also be evaluated in PAF. Since many equipment configurations in terms of size, ownership/rental/new vs. used exist on farms and fertilizer, labor, fuel and hay prices continually change, the need to assess relative profitability, greenhouse gas (GHG) emission and nutrient runoff effects of various practices arises. The PAF software is described in the publication available below and serves as a reference manual. The software works well using the Microsoft operating environment. Should you experience difficulties with Excel on your machine, please send an e-mail to Michael Popp (mpopp@uark.edu). Thank you.
![]() PAF-v1.0 - Please "Save As" to a directory on your computer. Before opening please close any other excel files that you may have open.
PAF-v1.0 - Please "Save As" to a directory on your computer. Before opening please close any other excel files that you may have open.
Related (open access) publications are:
To receive software updates for PRC, enter your email address below and click the submit button..
Please email Michael Popp to let him know if you wish to use the spreadsheet for research purposes. The program is available at no charge but a number of parameters are project-specific and are not easily modified to other situations without access to program code.
![]() PAF by Michael Popp,Karen Lindsay, Amanda Ashworth, Philip Moore, Phillip Owens,
Taylor Adams, Melissa McCarver, Becky Roark, Daniel Pote, and John Pennington is licensed
under a Creative Commons Attribution-NonCommercial-NoDerivs 3.0 Unported License
PAF by Michael Popp,Karen Lindsay, Amanda Ashworth, Philip Moore, Phillip Owens,
Taylor Adams, Melissa McCarver, Becky Roark, Daniel Pote, and John Pennington is licensed
under a Creative Commons Attribution-NonCommercial-NoDerivs 3.0 Unported License
The Litter Soil Crop Calculator (LSC) is an Excel® spreadsheet tool that allows comparison of commercial fertilizer, broadcasted litter, and subsurfaced litter methods for soil fertility management. With fertilizer prices increasing, subsurface application of litter with current technology can be economically feasible. The tool provides an interface where you can specify litter nutrient content, crop needs, time between successive litter applications, and equipment choices (new, used, custom). The novel application of litter below the soil surface, while costly, allows for greater nutrient retention than broadcasting. Quantifying costs and benefits of subsurfaced litter is complex. A related open access publication demonstrates how to use the tool along with some sensitivity analyses. Should you experience difficulties with Excel on your machine, please send an e-mail to Michael Popp (mpopp@uark.edu). Thank you.
![]() LSC-v1.0 - Please "Save As" to a directory on your computer. Before opening please close any other excel files that you may have open.
LSC-v1.0 - Please "Save As" to a directory on your computer. Before opening please close any other excel files that you may have open.
Related (open access) publications are:
To receive software updates for LSC, enter your email address below and click the submit button..
p
Please email Michael Popp to let him know if you wish to use the spreadsheet for research purposes. The program is available at no charge but a number of parameters are project-specific and are not easily modified to other situations without access to program code.
![]() LSC by Timothy Stults and Michael Popp is licensed under a Creative Commons Attribution-NonCommercial-NoDerivs 3.0 Unported License
LSC by Timothy Stults and Michael Popp is licensed under a Creative Commons Attribution-NonCommercial-NoDerivs 3.0 Unported License
 PSA is a spreadsheet-based software tool that analyzes investment in solar panels.
The tool is targeted for poultry producers and lenders that want to assess investment
feasibility by looking at the past 12 months of electricity bills prior to installing
solar panels. The user guide below describes what type of sensitivity analyses can
be performed and how to interpret the output. The software works well using the Microsoft
operating environment. Should you experience difficulties with Excel on your machine, please send an e-mail
to Michael Popp (mpopp@uark.edu). Thank you.
![]() PSA-v1.0 - Please "Save As" to a directory on your computer. Before opening please close any other excel files that you may have open. Also please
be sure to activate your ‘Solver’ add-in in Excel®. You can do so in the File/Options/Add-Ins
menu item and pressing Go… near the bottom of the screen. Make sure the Solver Add-in
option is checked and press “OK”.
PSA-v1.0 - Please "Save As" to a directory on your computer. Before opening please close any other excel files that you may have open. Also please
be sure to activate your ‘Solver’ add-in in Excel®. You can do so in the File/Options/Add-Ins
menu item and pressing Go… near the bottom of the screen. Make sure the Solver Add-in
option is checked and press “OK”.
![]() PSA-v2.0 - Please "Save As" to a directory on your computer. Before opening please close any other excel files that you may have open. Also please
be sure to activate your ‘Solver’ add-in in Excel®. You can do so in the File/Options/Add-Ins
menu item and pressing Go… near the bottom of the screen. Make sure the Solver Add-in
option is checked and press “OK”. You may also need to click on the file in the directory where you saved the file and
change Properties. Under Attributes in the General tab of Properties you may need
to Unlock the spreadsheet to allow the macros to work. Major updates include the ability
to specify a REAP grant and to optimize a set of two loans to minimize after tax cashflow
implications of investing in solar compared to relying on electric utilities without
solar panels.
PSA-v2.0 - Please "Save As" to a directory on your computer. Before opening please close any other excel files that you may have open. Also please
be sure to activate your ‘Solver’ add-in in Excel®. You can do so in the File/Options/Add-Ins
menu item and pressing Go… near the bottom of the screen. Make sure the Solver Add-in
option is checked and press “OK”. You may also need to click on the file in the directory where you saved the file and
change Properties. Under Attributes in the General tab of Properties you may need
to Unlock the spreadsheet to allow the macros to work. Major updates include the ability
to specify a REAP grant and to optimize a set of two loans to minimize after tax cashflow
implications of investing in solar compared to relying on electric utilities without
solar panels.
To receive software updates for PSA, enter your email address below and click the submit button.
Please email Michael Popp to let him know if you wish to use the spreadsheet for research purposes. The program is available at no charge but a number of parameters are project-specific and are not easily modified to other situations without access to program code.
![]() PSA by Michael Popp is licensed under a Creative Commons Attribution-NonCommercial-NoDerivs 3.0 Unported License
PSA by Michael Popp is licensed under a Creative Commons Attribution-NonCommercial-NoDerivs 3.0 Unported License
